
When we first created Eco-CI, our goal was to help developers get a more solid grasp of how their repeated processes cost energy and carbon, and be able to put some practical numbers to that concept. It is very easy to become detached to the reality of carbon emissions when there are many layers of abstraction and conversion, as is the case with CI processes. Often what we measure is the load on a machine (via cpu-utilization), and that gets converted to a number related to the energy pull of a server (that’s off somewhere) in Joules, and while we can then convert that to an estimation of grams of CO2 emitted, even that doesn’t feel very tangible. And the less tangible the effects of our choices are, the less likely we are to think about them and change. The goal here then is to try to solidify a connection between our CI pipeline usage and the environmental impact they have.
To do this, we have decided to look into the testing pipelines of a few popular open source repositories. We forked the repository, picked their testing workflow, and integrated Eco-CI to measure the energy use of that pipeline. Eco-CI is our GitHub/Gitlab plugin which measures the CPU-utilization of a pipeline while its running, detects underlying hardware specs of the virtual machine, and based on this information estimates the energy usage of the CI job using an ML model trained on SPEC power data. Here is an example of how we implemented it into the django tests workflow:
 javascript-tests:
    runs-on: ubuntu-latest
    name: JavaScript tests
    steps:
      - name: Eco-CI Init
        uses: green-coding-berlin/eco-ci-energy-estimation@main
        with:
          task: start-measurement

      - name: Checkout
        uses: actions/checkout@v3
      - name: Set up Node.js
        uses: actions/setup-node@v3
        with:
          node-version: '16'
          cache: 'npm'
          cache-dependency-path: '**/package.json'
      - run: npm install
      - run: npm test

      - name: Eco-CI Measurement
        uses: green-coding-berlin/eco-ci-energy-estimation@main
        with:
          task: get-measurement
          label: 'npm tests'

      - name: Eco-CI Results
        uses: green-coding-berlin/eco-ci-energy-estimation@main
        with:
          task: display-results
The repositories we chose were curl, django, and flask on GitHub, and openmw for GitLab (I’m personally a big Morrowind fan). These repositories vary quite a lot in how many workflows they have and how often they run, so I expect to see quite a big difference in the carbon footprint of these various projects. We decided to just measure one job of the main testing workflow for each for each repository (as we don’t want consume all of our GitHub minutes running multiple forked respositories’s entire workflow suite). We tracked this for a month, and saw the following results:
| Repository (link to tested workflow) | Total Energy Used (kWh) | gCO2e emitted |
|---|---|---|
| curl | 0.114 | 50.25 |
| django | 0.018 | 8.13 |
| flask | 0.014 | 6.32 |
| openmw | 0.774 | 342.31 |
The above shows how much energy the measured workflows used in total over the time period we measured. So there’s our first step towards figuring out what the impact is - getting an estimation of the energy used. To go then from mJ to gCO2e, we used the formulas that can be found on this page here - We used the carbon grid intensity of 442 gCO2/kWh at the time of writing.
Of course, these numbers are just based on the samples we ran ourselves once a day. In their original repositories, these workflows ran quite a bit more often and extensively. A good example of this is the curl workflow. This is the original workflow file on curl’s repository. You can see that this workflow runs 19 parallel jobs, building curl with a variety of different protocols and then running its test suite. It would feel foolish to run all these jobs ourselves as well in an effort to try to convince people that we need to minimize CO2 runs, so we measured one job and will now extrapolate the full usage of this pipeline.
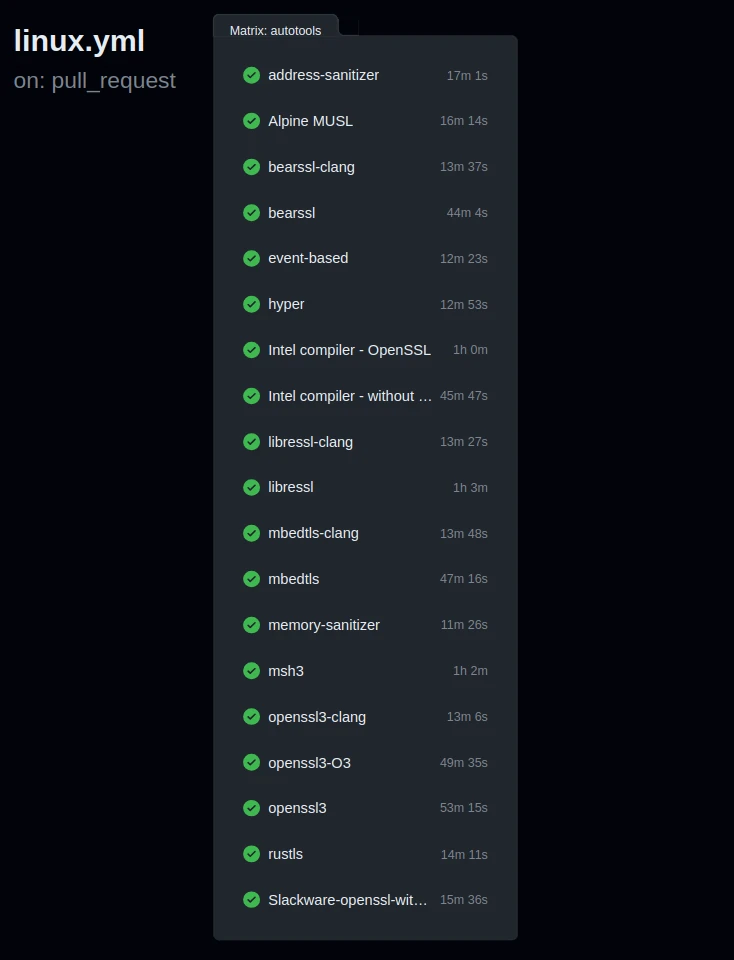
This will just be a back-of-the-envelope type estimate, but the job we measured (libressl) takes about an hour, where the full workflow uses about 600 minutes total, so our measured energy use is about 1/10th of the total real usage. Additionally, in the curl repository this workflow runs on a per-push basis, whereas we measured once a day. So we need to get a number for how often this workflow ran on the curl repository. To do this, I wrote a small script to collect all the workflow runs in January that were not cancelled or skipped for each repository:
import requests
import json

def fetch_workflow_runs(repo, workflow_id, token):
    print(f"Collecting {repo}")
    url = f"https://api.github.com/repos/{repo}/actions/workflows/{workflow_id}/runs"
    params = {
        "per_page": 100
    }
    headers = {
        "Authorization": f"token {token}"
    }
    all_runs = []

    while True:
        print(".", end="", flush=True)
        response = requests.get(url, params=params, headers=headers)
        data = response.json()
        runs = data['workflow_runs']

        for run in runs:
            created_at = run['created_at']
            if created_at < '2024-01-01T00:00:00Z':
                break
            if created_at < '2024-02-01T00:00:00Z':
                all_runs.append(run)

        if 'next' in response.links:
            url = response.links['next']['url']
        else:
            break

    return all_runs

repositories = [
    {"repo": "curl/curl", "workflow_file": "linux.yml", "workflow_id": 34788117},
    {"repo": "django/django", "workflow_file": "schedule_tests.yml", "workflow_id": 21767459},
    {"repo": "pallets/flask", "workflow_file": "tests.yaml", "workflow_id":1367898}
]

github_token = "<REDACTED>"

for repo_data in repositories:
    repo = repo_data['repo']
    workflow_file = repo_data['workflow_file']
    workflow_id = repo_data['workflow_id']
    runs = fetch_workflow_runs(repo, workflow_id, github_token)
    filtered_runs = [run for run in runs if run['conclusion'] not in ['cancelled', 'skipped']]

    output_filtered = f"{repo.replace('/', '_')}_{workflow_file.replace('.', '_')}_runs.json"
    with open(output_filtered, 'w') as f:
        json.dump(filtered_runs, f)

    print(f"\nSaved {len(filtered_runs)} runs for {repo} ({workflow_file})")
For curl, it amounts to 421 runs total. Since the carbon total that we calculated was based on 31 runs, our total energy estimated would be (measured carbon * 10) * (421/31) = 15374.64 gCO2e.
My apologies to the maintainers of curl - I’m not trying to call you out specifically, just looking at a real-world example of the carbon cost of a complete, complex, and well-built (from an automation perspective) CI suite.
Doing the same calculation for all the repositories measured above, we have:
curl: (50.25 * 10) * (421/31) = 6,824.27 gCO2e
django: (8.13 * 4.6) * (28/31) = 337.78 gCO2e
flask: (6.32 * 1.2 ) * (23/ 31) = 56.26  gCO2e
openmw: (342.31 * 1.5) * (178/31) = 2,948.28 gCO2e
Its nice to see that two of our repositories actually don’t use that much energy in the end! But digging a bit deeper we found out that most of Django’s CI is actually not happening on Github but rather on DjangoCI.
Now for the relevant bit - trying to put this carbon emission cost into some real world context that we can actually relate to. To do this we use this calculator to convert into some relatable contexts: the amount of miles driven by an average car to also emit this amount of gas, and the amount of carbon used to charge a smartphone from empty to full, and equivalent CO2 emissions from gallons of gasoline used. This helps make these values feel more palpable. Our final estimation of the total gCO2e for each repository for their testing workflow is as follows :
| Repository | Estimated gCO2e consumed | Miles Driven by Car | Smartphones Charged to Full | Gallons of Gasoline Consumed |
|---|---|---|---|---|
| curl | 6,824.27 | 17.5 | 830 | 0.768 |
| django | 337.78 | 0.866 | 41.1 | 0.038 |
| flask | 56.26 | 0.144 | 6.8 | 0.006 |
| openmw | 2,948.28 | 7.6 | 359 | 0.332 |
Still, this was only the testing workflows, and we want to highlight our point that CI processes can get a bit out of hand. So we decided to take a look at one more repository, specifically to find one that has many workflows running over many parallel jobs. We chose moby
Since we didn’t fork and measure this repository specifically, we have to make an estimation in a different way. In december GitHub introduced the AMD EPYC 7763 as the processor for the default machines that public workflow runs are made on. Since then all our measured runs have been on these machines. This makes estimations much easier as there is much less variance amongst machines with the same processors (see our case study about that here).
So first, we added up the total carbon emitted by our measured repositories and divided by the number of workflow seconds each took, to get an estimation of how much one second of workflow time costs in carbon on these machines. Doing so leads to an estimated average of 3.57 W for workflows on AMD EPYC 7763 github machines.
Then we measured up the total minutes used by all workflow runs in the moby repository in the same time period. There are 6 workflows of note: bin-image.yml, buildkit.yml, ci.yml, test.yml, windows-2019.yml, and windows-2022.yml. I went through the runs for each of these workflows and calculated an average number of seconds each workflow took based on a sample, including all parallel jobs (as ultimately, this is what matters). I then used a similar script as above to get the total number of runs for each of these workflows in the month of January, and got the following results:
| Workflow | Runs | Seconds each | Seconds total | Energy Total (kWh) | gCO2e |
|---|---|---|---|---|---|
| buildkit.yml | 514 | 6,360 | 3,269,040 | 3.24 | 1,432.08 |
| bin-image.yml | 541 | 1,410 | 762,810 | 0.76 | 335.92 |
| ci.yml | 563 | 1,860 | 1,047,180 | 1.04 | 459,86 |
| test.yml | 483 | 24,780 | 11,968,740 | 11.87 | 5,246.54 |
| windows-2019.yml | 31 | 52,920 | 1,640,520 | 1.63 | 724.88 |
| windows-2022.yml | 467 | 17,100 | 7,985,700 | 7.92 | 3,500.64 |
| TOTAL | - | - | - | 26.46 | 11,699.90 |
So the total for a single month would be 11,699.90 gCO2 And now to put it in some real world context:
- 30 miles driven
- 1.3 gallons of gasoline consumed
- 1,424 smartphones charged
While these numbers aren’t exactly scary, they are starting to feel tangible. And this is one repository, working for one month - when looking at the bigger picture we start to see how this can scale up.
Follow up
Github is due to release some new ARM runners soon which will bring more efficiency to the whole CI/CD space. We are excited and create a follow up piece on that.
In the meantime: Did you find this case study interesting? Let us know by making a post on LinkedIn and tagging us or by sending us an email to info@green-coding.io